
PLPL3
Real estatePlano & Plano Desenvolvimento Imobiliário
Price
R$4.74
+0.85%
P/E
3.12
P/VP
0.86
Dividend yield, 12 months
10.40%
Last income payment
R$0.49
12/30/2025
Market cap
R$962.5M
Daily liquidity
R$23.6M
Price over the last year
| Price | |
|---|---|
| 11/12/2025 | R$15.18 |
| 11/13/2025 | R$15.74 |
| 11/19/2025 | R$14.85 |
| 11/21/2025 | R$14.78 |
| 11/27/2025 | R$15.70 |
| 11/28/2025 | R$15.94 |
| 12/4/2025 | R$16.38 |
| 12/5/2025 | R$15.21 |
| 12/11/2025 | R$15.16 |
| 12/12/2025 | R$15.38 |
| 12/18/2025 | R$14.06 |
| 12/19/2025 | R$13.91 |
| 12/29/2025 | R$13.89 |
| 12/30/2025 | R$13.70 |
| 1/7/2026 | R$14.25 |
| 1/8/2026 | R$14.59 |
| 1/14/2026 | R$14.54 |
| 1/15/2026 | R$14.54 |
| 1/21/2026 | R$14.30 |
| 1/22/2026 | R$14.44 |
| 1/28/2026 | R$15.24 |
| 1/29/2026 | R$15.10 |
| 2/4/2026 | R$15.25 |
| 2/5/2026 | R$15.23 |
| 2/11/2026 | R$15.67 |
| 2/12/2026 | R$15.70 |
| 2/20/2026 | R$16.13 |
| 2/23/2026 | R$16.09 |
| 2/27/2026 | R$15.47 |
| 3/2/2026 | R$15.00 |
| 3/6/2026 | R$14.07 |
| 3/9/2026 | R$14.14 |
| 3/13/2026 | R$14.35 |
| 3/16/2026 | R$14.07 |
| 3/20/2026 | R$12.94 |
| 3/23/2026 | R$13.82 |
| 3/27/2026 | R$13.03 |
| 3/30/2026 | R$12.93 |
| 4/6/2026 | R$13.44 |
| 4/7/2026 | R$12.57 |
| 4/13/2026 | R$14.02 |
| 4/14/2026 | R$13.80 |
| 4/20/2026 | R$13.27 |
| 4/22/2026 | R$13.06 |
| 4/28/2026 | R$10.83 |
| 4/29/2026 | R$10.16 |
| 5/6/2026 | R$9.97 |
| 5/7/2026 | R$10.05 |
| 5/13/2026 | R$10.56 |
| 5/14/2026 | R$10.62 |
| 5/20/2026 | R$10.41 |
| 5/21/2026 | R$10.28 |
| 5/27/2026 | R$9.21 |
| 5/28/2026 | R$8.91 |
| 6/3/2026 | R$8.55 |
| 6/5/2026 | R$8.40 |
| 6/11/2026 | R$8.48 |
| 6/12/2026 | R$8.56 |
| 6/18/2026 | R$8.05 |
| 6/19/2026 | R$8.30 |
| 6/25/2026 | R$8.34 |
| 6/26/2026 | R$8.54 |
| 7/2/2026 | R$8.36 |
| 7/3/2026 | R$8.58 |
| 7/9/2026 | R$8.07 |
| 7/10/2026 | R$8.15 |
| 7/16/2026 | R$7.93 |
| 7/17/2026 | R$7.58 |
| 7/23/2026 | R$7.38 |
| 7/24/2026 | R$7.54 |
| 7/30/2026 | R$7.50 |
| 7/31/2026 | R$7.36 |
| 8/6/2026 | R$7.11 |
| 8/7/2026 | R$7.02 |
| 8/13/2026 | R$6.87 |
| 8/14/2026 | R$6.75 |
| 8/20/2026 | R$6.73 |
| 8/21/2026 | R$6.90 |
| 8/27/2026 | R$7.24 |
| 8/28/2026 | R$7.02 |
| 9/3/2026 | R$7.18 |
| 9/4/2026 | R$7.23 |
| 9/11/2026 | R$7.01 |
| 9/14/2026 | R$6.71 |
| 9/18/2026 | R$6.58 |
| 9/21/2026 | R$6.79 |
| 9/25/2026 | R$6.71 |
| 9/28/2026 | R$6.68 |
| 10/2/2026 | R$7.09 |
| 10/5/2026 | R$8.30 |
| 10/9/2026 | R$8.97 |
| 10/13/2026 | R$8.44 |
| 10/19/2026 | R$7.65 |
| 10/20/2026 | R$8.09 |
| 10/26/2026 | R$5.28 |
| 10/27/2026 | R$5.34 |
| 11/3/2026 | R$4.32 |
| 11/4/2026 | R$4.54 |
| 11/10/2026 | R$4.79 |
| 11/11/2026 | R$4.77 |
| 11/12/2026 | R$4.70 |
| 11/13/2026 | R$4.74 |
Against the Ibovespa and the CDI
Last 12 months, with base 100 on the first day. The price does not include the income paid.
| PLPL3 | Ibovespa | CDI | |
|---|---|---|---|
| 11/13/2025 | 100.0 | 100.0 | 100.0 |
| 11/14/2025 | 100.0 | 100.4 | 100.1 |
| 11/17/2025 | 100.0 | 99.9 | 100.1 |
| 11/18/2025 | 100.0 | 99.6 | 100.2 |
| 11/19/2025 | 94.4 | 98.9 | 100.2 |
| 11/21/2025 | 93.9 | 98.5 | 100.3 |
| 11/24/2025 | 93.9 | 98.8 | 100.3 |
| 11/25/2025 | 93.9 | 99.2 | 100.4 |
| 11/26/2025 | 93.9 | 100.9 | 100.4 |
| 11/27/2025 | 99.8 | 100.7 | 100.5 |
| 11/28/2025 | 101.3 | 101.2 | 100.6 |
| 12/1/2025 | 101.3 | 100.9 | 100.6 |
| 12/2/2025 | 101.3 | 102.5 | 100.7 |
| 12/3/2025 | 101.3 | 102.9 | 100.7 |
| 12/4/2025 | 104.1 | 104.6 | 100.8 |
| 12/5/2025 | 96.6 | 100.1 | 100.8 |
| 12/8/2025 | 96.6 | 100.7 | 100.9 |
| 12/9/2025 | 96.6 | 100.5 | 100.9 |
| 12/10/2025 | 96.6 | 101.2 | 101.0 |
| 12/11/2025 | 96.3 | 101.3 | 101.1 |
| 12/12/2025 | 97.7 | 102.3 | 101.1 |
| 12/15/2025 | 97.7 | 103.4 | 101.2 |
| 12/16/2025 | 97.7 | 100.9 | 101.2 |
| 12/17/2025 | 97.7 | 100.1 | 101.3 |
| 12/18/2025 | 89.3 | 100.5 | 101.3 |
| 12/19/2025 | 88.4 | 100.8 | 101.4 |
| 12/22/2025 | 88.4 | 100.6 | 101.4 |
| 12/23/2025 | 88.4 | 102.1 | 101.5 |
| 12/24/2025 | 88.4 | 102.1 | 101.6 |
| 12/26/2025 | 88.4 | 102.4 | 101.6 |
| 12/29/2025 | 88.3 | 102.1 | 101.7 |
| 12/30/2025 | 87.0 | 102.5 | 101.7 |
| 12/31/2025 | 87.0 | 102.5 | 101.8 |
| 1/2/2026 | 87.0 | 102.2 | 101.8 |
| 1/5/2026 | 87.0 | 103.0 | 101.9 |
| 1/6/2026 | 87.0 | 104.1 | 102.0 |
| 1/7/2026 | 90.5 | 103.1 | 102.0 |
| 1/8/2026 | 92.7 | 103.7 | 102.1 |
| 1/9/2026 | 92.7 | 104.0 | 102.1 |
| 1/12/2026 | 92.7 | 103.8 | 102.2 |
| 1/13/2026 | 92.7 | 103.1 | 102.2 |
| 1/14/2026 | 92.4 | 105.1 | 102.3 |
| 1/15/2026 | 92.4 | 105.4 | 102.3 |
| 1/16/2026 | 92.4 | 104.9 | 102.4 |
| 1/19/2026 | 92.4 | 104.9 | 102.5 |
| 1/20/2026 | 92.4 | 105.8 | 102.5 |
| 1/21/2026 | 90.9 | 109.3 | 102.6 |
| 1/22/2026 | 91.7 | 111.7 | 102.6 |
| 1/23/2026 | 91.7 | 113.8 | 102.7 |
| 1/26/2026 | 91.7 | 113.7 | 102.7 |
| 1/27/2026 | 91.7 | 115.8 | 102.8 |
| 1/28/2026 | 96.8 | 117.5 | 102.9 |
| 1/29/2026 | 95.9 | 116.5 | 102.9 |
| 1/30/2026 | 95.9 | 115.4 | 103.0 |
| 2/2/2026 | 95.9 | 116.3 | 103.0 |
| 2/3/2026 | 95.9 | 118.1 | 103.1 |
| 2/4/2026 | 96.9 | 115.6 | 103.1 |
| 2/5/2026 | 96.8 | 115.9 | 103.2 |
| 2/6/2026 | 96.8 | 116.4 | 103.3 |
| 2/9/2026 | 96.8 | 118.5 | 103.3 |
| 2/10/2026 | 96.8 | 118.3 | 103.4 |
| 2/11/2026 | 99.6 | 120.7 | 103.4 |
| 2/12/2026 | 99.8 | 119.5 | 103.5 |
| 2/13/2026 | 99.8 | 118.6 | 103.5 |
| 2/18/2026 | 99.8 | 118.4 | 103.6 |
| 2/19/2026 | 99.8 | 120.0 | 103.7 |
| 2/20/2026 | 102.5 | 121.2 | 103.7 |
| 2/23/2026 | 102.2 | 120.2 | 103.8 |
| 2/24/2026 | 102.2 | 121.8 | 103.8 |
| 2/25/2026 | 102.2 | 121.7 | 103.9 |
| 2/26/2026 | 102.2 | 121.5 | 103.9 |
| 2/27/2026 | 98.3 | 120.1 | 104.0 |
| 3/2/2026 | 95.3 | 120.5 | 104.1 |
| 3/3/2026 | 95.3 | 116.5 | 104.1 |
| 3/4/2026 | 95.3 | 118.0 | 104.2 |
| 3/5/2026 | 95.3 | 114.8 | 104.2 |
| 3/6/2026 | 89.4 | 114.1 | 104.3 |
| 3/9/2026 | 89.8 | 115.1 | 104.3 |
| 3/10/2026 | 89.8 | 116.7 | 104.4 |
| 3/11/2026 | 89.8 | 117.1 | 104.5 |
| 3/12/2026 | 89.8 | 114.1 | 104.5 |
| 3/13/2026 | 91.2 | 113.0 | 104.6 |
| 3/16/2026 | 89.4 | 114.5 | 104.6 |
| 3/17/2026 | 89.4 | 114.8 | 104.7 |
| 3/18/2026 | 89.4 | 114.3 | 104.7 |
| 3/19/2026 | 89.4 | 114.7 | 104.8 |
| 3/20/2026 | 82.2 | 112.1 | 104.9 |
| 3/23/2026 | 87.8 | 115.8 | 104.9 |
| 3/24/2026 | 87.8 | 116.1 | 105.0 |
| 3/25/2026 | 87.8 | 118.0 | 105.0 |
| 3/26/2026 | 87.8 | 116.3 | 105.1 |
| 3/27/2026 | 82.8 | 115.5 | 105.1 |
| 3/30/2026 | 82.2 | 116.1 | 105.2 |
| 3/31/2026 | 82.2 | 119.3 | 105.3 |
| 4/1/2026 | 82.2 | 119.6 | 105.3 |
| 4/2/2026 | 82.2 | 119.7 | 105.4 |
| 4/6/2026 | 85.4 | 119.7 | 105.4 |
| 4/7/2026 | 79.9 | 119.8 | 105.5 |
| 4/8/2026 | 79.9 | 122.3 | 105.5 |
| 4/9/2026 | 79.9 | 124.2 | 105.6 |
| 4/10/2026 | 79.9 | 125.6 | 105.7 |
| 4/13/2026 | 89.1 | 126.0 | 105.7 |
| 4/14/2026 | 87.7 | 126.4 | 105.8 |
| 4/15/2026 | 87.7 | 125.8 | 105.8 |
| 4/16/2026 | 87.7 | 125.2 | 105.9 |
| 4/17/2026 | 87.7 | 124.5 | 105.9 |
| 4/20/2026 | 84.3 | 124.8 | 106.0 |
| 4/22/2026 | 83.0 | 122.7 | 106.1 |
| 4/23/2026 | 83.0 | 121.8 | 106.1 |
| 4/24/2026 | 83.0 | 121.4 | 106.2 |
| 4/27/2026 | 83.0 | 120.6 | 106.2 |
| 4/28/2026 | 68.8 | 120.0 | 106.3 |
| 4/29/2026 | 64.6 | 117.6 | 106.3 |
| 4/30/2026 | 64.6 | 119.2 | 106.4 |
| 5/4/2026 | 64.6 | 118.1 | 106.5 |
| 5/5/2026 | 64.6 | 118.8 | 106.5 |
| 5/6/2026 | 63.3 | 119.4 | 106.6 |
| 5/7/2026 | 63.9 | 116.6 | 106.6 |
| 5/8/2026 | 63.9 | 117.2 | 106.7 |
| 5/11/2026 | 63.9 | 115.8 | 106.7 |
| 5/12/2026 | 63.9 | 114.8 | 106.8 |
| 5/13/2026 | 67.1 | 112.7 | 106.9 |
| 5/14/2026 | 67.5 | 113.5 | 106.9 |
| 5/15/2026 | 67.5 | 112.8 | 107.0 |
| 5/18/2026 | 67.5 | 112.6 | 107.0 |
| 5/19/2026 | 67.5 | 110.9 | 107.1 |
| 5/20/2026 | 66.1 | 112.9 | 107.1 |
| 5/21/2026 | 65.3 | 113.0 | 107.2 |
| 5/22/2026 | 65.3 | 112.1 | 107.3 |
| 5/25/2026 | 65.3 | 112.9 | 107.3 |
| 5/26/2026 | 65.3 | 112.4 | 107.4 |
| 5/27/2026 | 58.5 | 111.8 | 107.4 |
| 5/28/2026 | 56.6 | 111.4 | 107.5 |
| 5/29/2026 | 56.6 | 110.6 | 107.5 |
| 6/1/2026 | 56.6 | 109.6 | 107.6 |
| 6/2/2026 | 56.6 | 110.8 | 107.7 |
| 6/3/2026 | 54.3 | 108.4 | 107.7 |
| 6/5/2026 | 53.4 | 107.5 | 107.8 |
| 6/8/2026 | 53.4 | 107.3 | 107.8 |
| 6/9/2026 | 53.4 | 108.1 | 107.9 |
| 6/10/2026 | 53.4 | 107.3 | 107.9 |
| 6/11/2026 | 53.9 | 109.1 | 108.0 |
| 6/12/2026 | 54.4 | 108.9 | 108.1 |
| 6/15/2026 | 54.4 | 108.4 | 108.1 |
| 6/16/2026 | 54.4 | 108.0 | 108.2 |
| 6/17/2026 | 54.4 | 107.2 | 108.2 |
| 6/18/2026 | 51.1 | 107.1 | 108.3 |
| 6/19/2026 | 52.7 | 107.3 | 108.4 |
| 6/22/2026 | 52.7 | 108.4 | 108.4 |
| 6/23/2026 | 52.7 | 109.0 | 108.5 |
| 6/24/2026 | 52.7 | 108.5 | 108.5 |
| 6/25/2026 | 53.0 | 109.4 | 108.6 |
| 6/26/2026 | 54.3 | 110.3 | 108.6 |
| 6/29/2026 | 54.3 | 110.2 | 108.7 |
| 6/30/2026 | 54.3 | 109.5 | 108.7 |
| 7/1/2026 | 54.3 | 109.2 | 108.8 |
| 7/2/2026 | 53.1 | 109.9 | 108.9 |
| 7/3/2026 | 54.5 | 110.9 | 108.9 |
| 7/6/2026 | 54.5 | 109.7 | 109.0 |
| 7/7/2026 | 54.5 | 109.5 | 109.0 |
| 7/8/2026 | 54.5 | 108.6 | 109.1 |
| 7/9/2026 | 51.3 | 109.9 | 109.2 |
| 7/10/2026 | 51.8 | 113.2 | 109.2 |
| 7/13/2026 | 51.8 | 111.8 | 109.3 |
| 7/14/2026 | 51.8 | 112.4 | 109.3 |
| 7/15/2026 | 51.8 | 112.0 | 109.4 |
| 7/16/2026 | 50.4 | 110.6 | 109.4 |
| 7/17/2026 | 48.2 | 110.5 | 109.5 |
| 7/20/2026 | 48.2 | 110.3 | 109.6 |
| 7/21/2026 | 48.2 | 110.3 | 109.6 |
| 7/22/2026 | 48.2 | 113.0 | 109.7 |
| 7/23/2026 | 46.9 | 112.5 | 109.7 |
| 7/24/2026 | 47.9 | 110.7 | 109.8 |
| 7/27/2026 | 47.9 | 111.6 | 109.8 |
| 7/28/2026 | 47.9 | 112.4 | 109.9 |
| 7/29/2026 | 47.9 | 110.6 | 110.0 |
| 7/30/2026 | 47.7 | 112.7 | 110.0 |
| 7/31/2026 | 46.8 | 113.3 | 110.1 |
| 8/3/2026 | 46.8 | 113.3 | 110.1 |
| 8/4/2026 | 46.8 | 113.2 | 110.2 |
| 8/5/2026 | 46.8 | 113.1 | 110.2 |
| 8/6/2026 | 45.2 | 111.7 | 110.3 |
| 8/7/2026 | 44.6 | 109.8 | 110.4 |
| 8/10/2026 | 44.6 | 109.6 | 110.4 |
| 8/11/2026 | 44.6 | 106.8 | 110.5 |
| 8/12/2026 | 44.6 | 106.6 | 110.5 |
| 8/13/2026 | 43.7 | 106.3 | 110.6 |
| 8/14/2026 | 42.9 | 106.2 | 110.6 |
| 8/17/2026 | 42.9 | 106.1 | 110.7 |
| 8/18/2026 | 42.9 | 105.8 | 110.8 |
| 8/19/2026 | 42.9 | 106.8 | 110.8 |
| 8/20/2026 | 42.8 | 106.9 | 110.9 |
| 8/21/2026 | 43.8 | 108.8 | 110.9 |
| 8/24/2026 | 43.8 | 109.4 | 111.0 |
| 8/25/2026 | 43.8 | 111.1 | 111.0 |
| 8/26/2026 | 43.8 | 111.1 | 111.1 |
| 8/27/2026 | 46.0 | 111.4 | 111.2 |
| 8/28/2026 | 44.6 | 111.8 | 111.2 |
| 8/31/2026 | 44.6 | 112.9 | 111.3 |
| 9/1/2026 | 44.6 | 114.4 | 111.3 |
| 9/2/2026 | 44.6 | 117.8 | 111.4 |
| 9/3/2026 | 45.6 | 117.8 | 111.4 |
| 9/4/2026 | 45.9 | 117.8 | 111.5 |
| 9/8/2026 | 45.9 | 119.2 | 111.6 |
| 9/9/2026 | 45.9 | 118.1 | 111.6 |
| 9/10/2026 | 45.9 | 119.8 | 111.7 |
| 9/11/2026 | 44.5 | 119.1 | 111.7 |
| 9/14/2026 | 42.6 | 118.0 | 111.8 |
| 9/15/2026 | 42.6 | 118.7 | 111.9 |
| 9/16/2026 | 42.6 | 118.1 | 111.9 |
| 9/17/2026 | 42.6 | 118.3 | 112.0 |
| 9/18/2026 | 41.8 | 117.9 | 112.0 |
| 9/21/2026 | 43.1 | 118.7 | 112.1 |
| 9/22/2026 | 43.1 | 119.3 | 112.1 |
| 9/23/2026 | 43.1 | 118.2 | 112.2 |
| 9/24/2026 | 43.1 | 117.1 | 112.2 |
| 9/25/2026 | 42.6 | 116.7 | 112.3 |
| 9/28/2026 | 42.4 | 116.4 | 112.4 |
| 9/29/2026 | 42.4 | 117.0 | 112.4 |
| 9/30/2026 | 42.4 | 118.6 | 112.5 |
| 10/1/2026 | 42.4 | 119.1 | 112.5 |
| 10/2/2026 | 45.0 | 122.2 | 112.6 |
| 10/5/2026 | 52.7 | 131.7 | 112.6 |
| 10/6/2026 | 52.7 | 131.0 | 112.7 |
| 10/7/2026 | 52.7 | 130.0 | 112.8 |
| 10/8/2026 | 52.7 | 131.2 | 112.8 |
| 10/9/2026 | 57.0 | 133.0 | 112.9 |
| 10/13/2026 | 53.6 | 131.6 | 112.9 |
| 10/14/2026 | 53.6 | 131.4 | 113.0 |
| 10/15/2026 | 53.6 | 130.0 | 113.1 |
| 10/16/2026 | 53.6 | 130.7 | 113.1 |
| 10/19/2026 | 48.6 | 130.5 | 113.2 |
| 10/20/2026 | 51.4 | 132.5 | 113.2 |
| 10/21/2026 | 51.4 | 131.4 | 113.3 |
| 10/22/2026 | 51.4 | 129.9 | 113.3 |
| 10/23/2026 | 51.4 | 130.5 | 113.4 |
| 10/26/2026 | 33.6 | 112.4 | 113.5 |
| 10/27/2026 | 33.9 | 111.8 | 113.5 |
| 10/28/2026 | 33.9 | 108.8 | 113.6 |
| 10/29/2026 | 33.9 | 107.7 | 113.6 |
| 10/30/2026 | 33.9 | 106.9 | 113.7 |
| 11/3/2026 | 27.5 | 105.3 | 113.7 |
| 11/4/2026 | 28.8 | 106.6 | 113.8 |
| 11/5/2026 | 28.8 | 105.8 | 113.9 |
| 11/6/2026 | 28.8 | 107.2 | 113.9 |
| 11/9/2026 | 28.8 | 109.6 | 114.0 |
| 11/10/2026 | 30.4 | 109.0 | 114.0 |
| 11/11/2026 | 30.3 | 109.5 | 114.1 |
| 11/12/2026 | 29.9 | 109.0 | 114.1 |
Income paid per share
| Income | |
|---|---|
| 12/30/2025 | R$0.49 |
Summary of PLPL3
- The P/E of 3.12 is below the sector median (4.73).
- ROE is 31.77%: the company earns a good return on equity.
- It made a profit in all of the last 4 reported years.
- The price is 189.45% below the Graham fair price.
Sentences generated automatically from the numbers on this page. They are not a recommendation to buy or sell.
Profitability and debt
ROE
31.77%
Net margin
8.62%
Gross margin
28.56%
Operating margin
12.96%
EBITDA margin
13.46%
Gross debt/equity
1.20x
Net debt/EBITDA
1.22x
EV/EBITDA
3.45x
Current ratio
3.01
Fair price
Graham fair price
R$13.72
Price 189.5% below this value
Bazin price ceiling
R$8.21
Price 73.2% below this value
Graham: square root of 22.5 × earnings per share × book value per share. Bazin: dividends paid in 12 months ÷ 6%. They are simple study methods that ignore the growth and risk of the company; they are not a recommendation.
Annual income statement
| 2022 | 2023 | 2024 | 2025 | |
|---|---|---|---|---|
| Revenue | R$1.5B | R$2.1B | R$2.6B | R$3.3B |
| Gross profit | R$0.0 | R$0.0 | R$0.0 | R$0.0 |
| EBIT | R$0.0 | R$0.0 | R$0.0 | R$0.0 |
| Net income | R$133.7M | R$268.6M | R$343.8M | R$362.0M |
- Annual revenue growth:30.04%
- Annual profit growth:39.39%
- Profitable years:4 of 4
Amounts in Brazilian reais, from the published annual statements (source: Yahoo Finance). Balance sheet and cash flow are not available from this source.
Comparison with the sector
Median of the 31 companies in the real estate sector with the indicator available.
| Indicator | PLPL3 | Sector median | Rank |
|---|---|---|---|
| P/E | 3.12 | 4.73 | Higher than 2 of 21 |
| P/VP | 0.86 | 0.61 | Higher than 15 of 24 |
| Dividend yield, 12 months | 10.40% | 15.47% | Higher than 6 of 21 |
| ROE | 31.77% | 11.13% | Higher than 22 of 25 |
How to read the indicators
P/E
How many years of current earnings the price pays for. The lower, the cheaper the stock relative to profit, but falling or one-off profit distorts the number.
P/B
Compares the price with the book value per share. Below 1 means a discount to book value; above 1, a premium.
Dividend yield
Dividends paid in the last 12 months divided by the price. Extraordinary dividends can inflate the number.
ROE
Profit divided by shareholders equity: shows what the company earns on shareholder capital. Highly indebted companies can show a high ROE through leverage.
Net debt/EBITDA
How many years of operating cash generation it would take to repay net debt. Above 3 usually calls for attention. It does not apply well to banks.
About PLPL3
The stock PLPL3 of Plano & Plano Desenvolvimento Imobiliário trades on B3 and is in the real estate sector, priced at R$4.74 with a market cap of R$962.5M. The P/E is 3.12, the P/B is 0.86 and the 12-month dividend yield is 10.40%.
Fund data
- Ticker
- PLPL3
- Official name
- Plano & Plano Desenvolvimento Imobiliário S.A.
- Category
- Real estate
Frequently asked questions
How much does PLPL3 pay in dividends?
Over the last 12 months the stock PLPL3 (Plano & Plano Desenvolvimento Imobiliário) had a dividend yield of 10.40%, with the last payout of R$0.49 per share. The price is R$4.74.
Is PLPL3 expensive or cheap by P/E?
The P/E is 3.12: the price is 3.12 times earnings per share over the last 12 months. Compare it with companies in the same sector and look at earnings growth before drawing conclusions.
What does the P/B of PLPL3 show?
The P/B is 0.86: the price is 0.86 times book value per share. Below 1 means a discount to book value and above 1 a premium.
Other funds in the real estate category
| Stock | Price | P/E | P/VP | DY 12m |
|---|---|---|---|---|
| ALOS3Allos | R$27.05 | 12.18 | 1.06 | 13.0% |
| MULT3Multiplan Empreendimentos Imobiliários | R$27.34 | 8.73 | 1.92 | 4.3% |
| IGTI4Iguatemi | R$9.85 | 12.47 | 0.54 | 2.9% |
| CURY3Cury Construtora e Incorporadora | R$28.80 | 7.58 | 6.42 | 15.0% |
| JHSF3JHSF Participações | R$9.78 | 3.15 | 0.86 | 8.1% |
| DIRR3Direcional Engenharia | R$9.53 | 5.85 | 1.97 | 16.3% |
Sources: Yahoo Finance (price, income, volume, earnings and book value per share, delayed). Information for tracking only, not investment advice. Check the data at the source before deciding.
Track your investments
Add PLPL3 to your JuntaTudo portfolio and follow its price, income and price alerts together with the rest of your wealth.
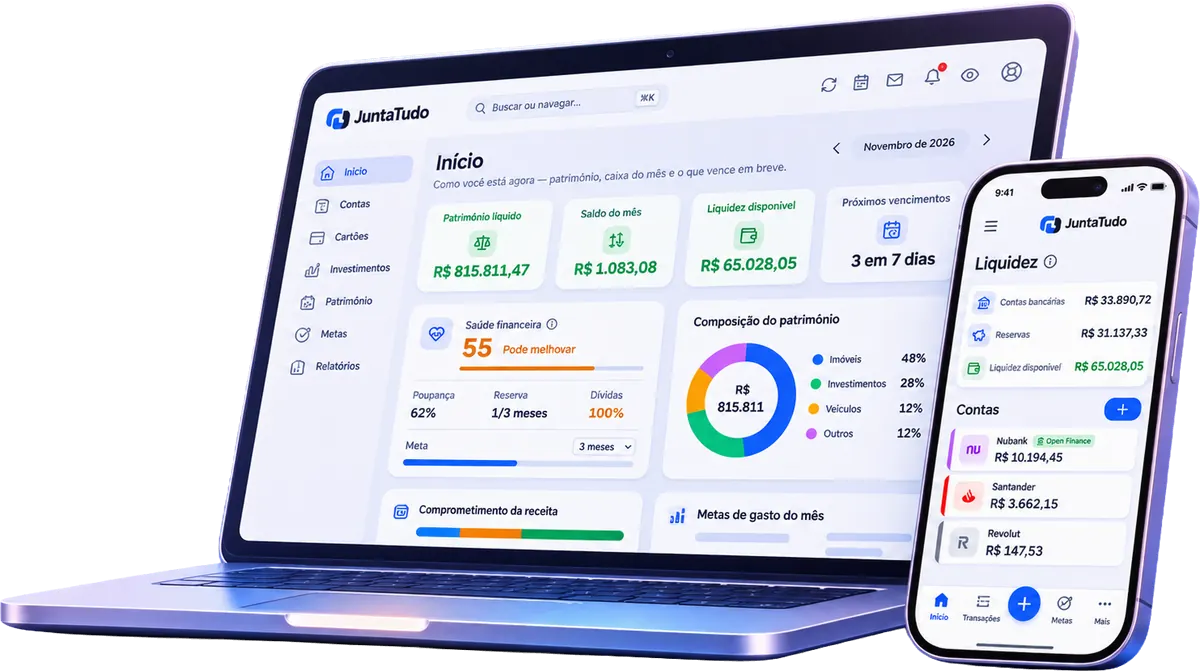
Your money, all in one place
Accounts, cards, investments and goals in a single app. Financial Market is a gift from JuntaTudo.
- Accounts and cards
- Investments and goals
- Juntin, the AI that puts it together