
Financial Market — open data, no sign-up
Selic, CDI, inflation, the dollar, stock indices and Tesouro Direto in one place. The same data JuntaTudo uses to track your money.
Securities comparison
Put up to 6 assets side by side.
- Stocks
- REITs (FIIs)
- ETFs
- FI-Infra
- Fiagro
- Price
- Dividend yield
- P/E
- P/B
- Return
Pick up to 6 securities. The page address keeps your choice: copy the link to share it.
| Price | |
|---|---|
| Price | R$9.80 |
| Change today | +1.14% |
| Income | |
| Dividend yield, 12 months | 3.42% |
| Last income payment | R$0.09 |
| What the market pays | |
| P/E | 9.07 |
| P/VP | 2.43 |
| Size and trading | |
| Market cap | R$1.5B |
| Daily liquidity | R$17.4M |
Price over the last year (base 100)
| TFCO4 | |
|---|---|
| 11/12/2025 | 100.0 |
| 11/13/2025 | 96.5 |
| 11/19/2025 | 90.3 |
| 11/21/2025 | 90.3 |
| 11/27/2025 | 101.4 |
| 11/28/2025 | 101.4 |
| 12/4/2025 | 100.8 |
| 12/5/2025 | 93.8 |
| 12/11/2025 | 92.5 |
| 12/12/2025 | 93.7 |
| 12/18/2025 | 88.3 |
| 12/19/2025 | 88.9 |
| 12/29/2025 | 90.9 |
| 12/30/2025 | 92.5 |
| 1/7/2026 | 91.5 |
| 1/8/2026 | 92.5 |
| 1/14/2026 | 89.1 |
| 1/15/2026 | 87.0 |
| 1/21/2026 | 87.3 |
| 1/22/2026 | 89.6 |
| 1/28/2026 | 91.0 |
| 1/29/2026 | 88.5 |
| 2/4/2026 | 89.6 |
| 2/5/2026 | 91.4 |
| 2/11/2026 | 97.1 |
| 2/12/2026 | 95.1 |
| 2/20/2026 | 96.7 |
| 2/23/2026 | 95.4 |
| 2/27/2026 | 99.2 |
| 3/2/2026 | 98.5 |
| 3/6/2026 | 91.9 |
| 3/9/2026 | 93.5 |
| 3/13/2026 | 90.4 |
| 3/16/2026 | 93.5 |
| 3/20/2026 | 88.5 |
| 3/23/2026 | 93.1 |
| 3/27/2026 | 89.5 |
| 3/30/2026 | 88.4 |
| 4/6/2026 | 89.3 |
| 4/7/2026 | 87.3 |
| 4/13/2026 | 92.3 |
| 4/14/2026 | 89.3 |
| 4/20/2026 | 91.4 |
| 4/22/2026 | 90.8 |
| 4/28/2026 | 86.9 |
| 4/29/2026 | 84.7 |
| 5/6/2026 | 91.8 |
| 5/7/2026 | 90.8 |
| 5/13/2026 | 83.7 |
| 5/14/2026 | 87.1 |
| 5/20/2026 | 85.1 |
| 5/21/2026 | 83.7 |
| 5/27/2026 | 81.0 |
| 5/28/2026 | 81.4 |
| 6/3/2026 | 82.8 |
| 6/5/2026 | 83.0 |
| 6/11/2026 | 90.1 |
| 6/12/2026 | 89.8 |
| 6/18/2026 | 82.9 |
| 6/19/2026 | 83.8 |
| 6/25/2026 | 86.0 |
| 6/26/2026 | 87.5 |
| 7/2/2026 | 87.1 |
| 7/3/2026 | 85.2 |
| 7/9/2026 | 83.4 |
| 7/10/2026 | 85.8 |
| 7/16/2026 | 82.9 |
| 7/17/2026 | 80.9 |
| 7/23/2026 | 80.0 |
| 7/24/2026 | 78.9 |
| 7/30/2026 | 82.0 |
| 7/31/2026 | 83.4 |
| 8/6/2026 | 84.3 |
| 8/7/2026 | 82.9 |
| 8/13/2026 | 76.7 |
| 8/14/2026 | 75.4 |
| 8/20/2026 | 72.5 |
| 8/21/2026 | 73.2 |
| 8/27/2026 | 72.4 |
| 8/28/2026 | 73.2 |
| 9/3/2026 | 74.4 |
| 9/4/2026 | 74.1 |
| 9/11/2026 | 73.9 |
| 9/14/2026 | 73.4 |
| 9/18/2026 | 74.6 |
| 9/21/2026 | 75.3 |
| 9/25/2026 | 75.3 |
| 9/28/2026 | 74.4 |
| 10/2/2026 | 76.1 |
| 10/5/2026 | 84.3 |
| 10/9/2026 | 87.9 |
| 10/13/2026 | 80.8 |
| 10/19/2026 | 80.3 |
| 10/20/2026 | 83.7 |
| 10/26/2026 | 60.2 |
| 10/27/2026 | 60.7 |
| 11/3/2026 | 55.5 |
| 11/4/2026 | 56.5 |
| 11/10/2026 | 57.3 |
| 11/11/2026 | 56.9 |
| 11/12/2026 | 55.0 |
| 11/13/2026 | 55.6 |
Informational comparison, not investment advice.
Explore the market
Choose what you want to follow.
Indicators
Selic, CDI, savings, inflation, dollar and euro.
Indices
Ibovespa, IFIX, SMLL, IDIV and the US markets.
Crypto
Bitcoin, Ethereum and more: price in reais and 24-hour change.
Currencies and commodities
Dollar, euro, pound, gold, silver and oil.
Treasury bonds
Bonds for sale, rate, maturity and price.
Stocks
Price, P/E, P/B and dividend yield of stocks.
REITs (FIIs)
Price, dividend yield and P/VP of B3 real estate funds.
ETFs
Price, 12-month return and liquidity of ETFs.
FI-Infra
Price, dividend yield and liquidity of FI-Infra funds.
Fiagro
Price, dividend yield and liquidity of Fiagro funds.
Funds
Return, % of CDI, net assets and shareholders of funds.
My favorites
Tap the heart next to an index or Treasury bond to follow it here.
Favorites are kept only in this browser: no account, nothing is sent.
Central Bank indicators
Selic, CDI, savings, inflation, dollar and euro.
Selic (target)
13.75% a year
Target set by the Copom · 12/9/2026
CDI
13.65% a year
per year, 252-day basis · 11/12/2026
Savings account
0.67% a month
yield for the month · 11/12/2026
Selic overnight
13.65% a year
per year, average daily rate · 11/13/2026
TR (reference rate)
0.17% a month
in the month · 11/12/2026
IPCA, 12 months
4.63%
accumulated · October 2026
Daily gainers and losers
Among the most traded B3 stocks.
Biggest gainers
Recent income
Dividends and distributions recorded in the last 30 days.
The date is the one the source records for the payout; confirm the payment date and amount in the asset's official notice.
Stock indices
Ibovespa, IFIX, SMLL, IDIV and the US markets.
| Index | Points | Day |
|---|---|---|
| Ibovespa | 172,458.00 | +0.66% |
| IFIX | 3,615.23 | +1.36% |
| SMLL | 2,032.89 | +1.01% |
| IDIV | 12,094.16 | +0.76% |
Crypto
Bitcoin, Ethereum and more: price in reais and 24-hour change.
| Coin | Price | 24 h |
|---|---|---|
| BitcoinBTC | R$376,680.00 | −1.82% |
| EthereumETH | R$10,464.71 | −3.74% |
| TetherUSDT | R$5.7301 | +0.23% |
| XRPXRP | R$5.48 | −2.94% |
Tesouro Direto
Bonds for sale, rate, maturity and price.
| Bond | Rate | Price |
|---|---|---|
Tesouro Selic 2031 | SELIC + 0,1076% | R$20,211.26 |
Tesouro Prefixado 2029 | 14,72% | R$748.74 |
Tesouro Prefixado 2032 | 15,19% | R$486.49 |
Tesouro Prefixado com Juros Semestrais 2037 | 15,19% | R$786.23 |
Tesouro IPCA+ 2032 | IPCA + 7,70% | R$3,124.32 |
Tesouro IPCA+ 2040 | IPCA + 7,46% | R$1,785.18 |
Stocks
Price, P/E, P/B and dividend yield of stocks.
| Stock | Price | P/E | DY 12m |
|---|---|---|---|
| PETR4Petróleo Brasileiro | R$45.30 | 4.11 | 8.1% |
| VALE3Vale | R$63.50 | 76.51 | 8.8% |
| ITUB4Itaú Unibanco Holding | R$42.27 | 9.99 | 7.3% |
| BPAC11Banco BTG Pactual | R$54.00 | — | 2.6% |
| BBDC4Banco Bradesco | R$14.52 | 6.15 | 11.1% |
| BBAS3Banco do Brasil | R$15.10 | 7.82 | 4.3% |
REITs (FIIs)
Price, dividend yield and P/VP of B3 real estate funds.
| Fund | Price | DY 12m | P/VP |
|---|---|---|---|
| TRXF11Trx Real Estate | R$55.79 | 19.5% | 0.58 |
| KNCR11Kinea Rendimentos Imobiliarios | R$104.86 | 13.1% | 1.02 |
| MXRF11Maxi Renda RL | R$8.75 | 13.6% | 0.94 |
| XPML11XP Malls | R$92.00 | 12.0% | 0.86 |
| BTLG11Btgp Logistica | R$98.75 | 9.8% | 0.93 |
| TRXB11Trx Real Estate II | R$198.00 | 16.8% | 2.03 |
ETFs
Price, 12-month return and liquidity of ETFs.
| Fund | Price | 12 months |
|---|---|---|
| BOVA11iShares Ibovespa | R$169.68 | +10.11% |
| SMAL11iShares BM&FBOVESPA Small CAP | R$99.53 | −12.00% |
| BOVV11IT Now Ibovespa | R$178.00 | +10.26% |
| IVVB11iShares S&P 500 | R$483.15 | +20.34% |
| LFTB11Investo ETF Marketvector Brazil Treasury 760 DAY Target Duration | R$128.77 | +13.29% |
| LLFT11BTG Pactual Teva Tesouro Selic | R$121.23 | +16.44% |
FI-Infra
Price, dividend yield and liquidity of FI-Infra funds.
| Fund | Price | DY 12m |
|---|---|---|
| BISE11Bradesco Isento 2031 | R$108.05 | — |
| ISNT11Itau Isento Marco 28 | R$1,172.09 | — |
| CDII11Sparta Infra Cdi | R$88.40 | 15.8% |
| ISTT11Itau Isento Setembro 29 | R$1,174.59 | — |
| ISNN11Itau Isento Julho 28 | R$1,134.14 | — |
| ISEN11Itaú Isento Março 29 | R$120.72 | — |
Fiagro
Price, dividend yield and liquidity of Fiagro funds.
| Fund | Price | DY 12m |
|---|---|---|
| KNCA11Kinea Credito Agro | R$87.00 | 13.1% |
| RURA11Itau Asset Rural | R$7.24 | 16.6% |
| SNAG11Suno Agro | R$9.77 | 16.2% |
| VGIA11Valora Cra | R$8.31 | 17.7% |
| RZAG11Fundo De Investimento Nas Cadeias Produtivas Agroindustriais Riza Agro | R$7.78 | 17.7% |
| FGAA11FG/Agro | R$7.66 | 17.8% |
TradingView · delayed
Market now
This chart is from TradingView, a third-party service: once loaded, it receives your IP address and may store cookies. We only load it after you click.
Quotes and chart by TradingView, delayed.
Information for tracking only, not investment advice. Check the data at the source before deciding.
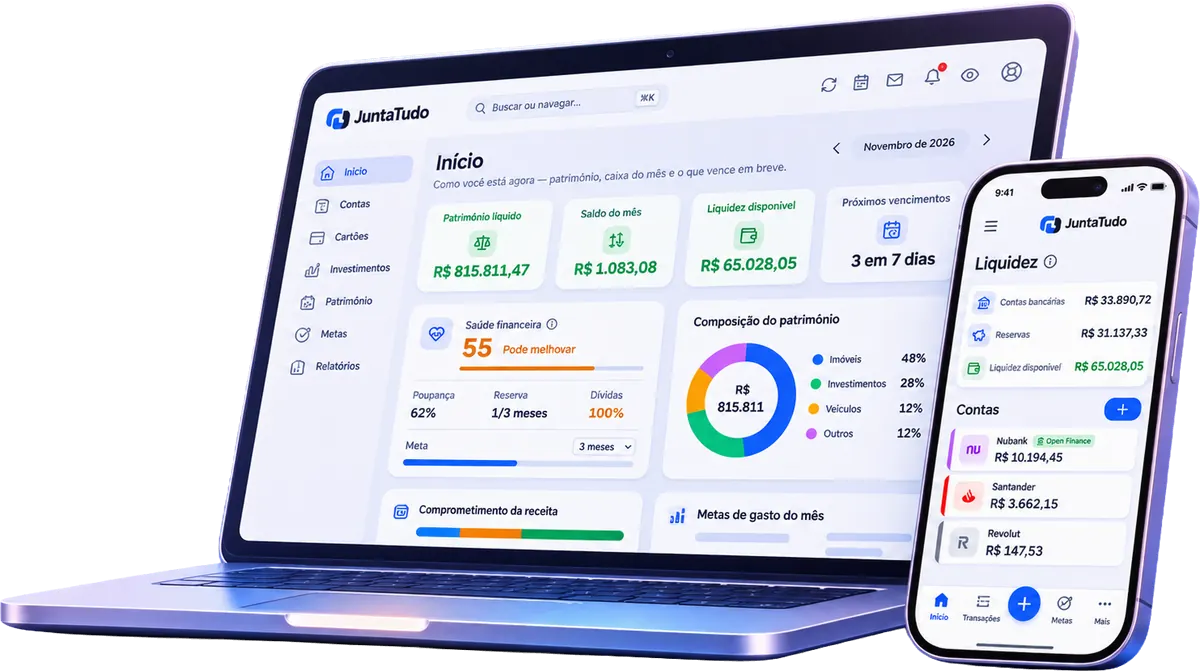
Your money, all in one place
Accounts, cards, investments and goals in a single app. Financial Market is a gift from JuntaTudo.
- Accounts and cards
- Investments and goals
- Juntin, the AI that puts it together